Review journey analytics
Open a Journey and use Overview for configuration context. Then open Analytics for the aggregate funnel and rates.
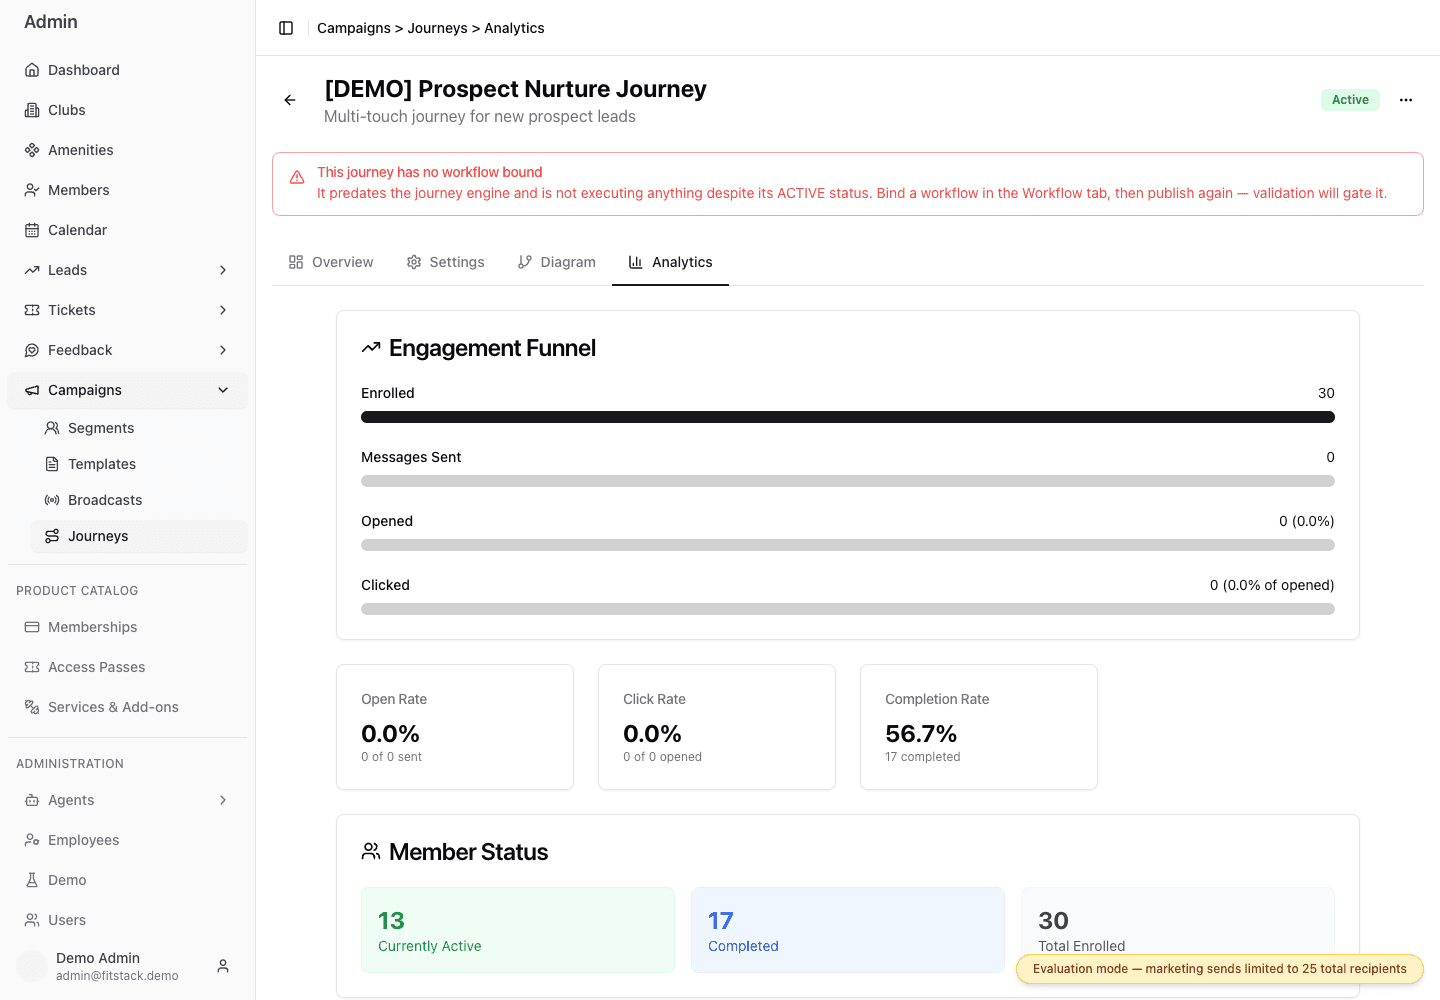
- 1Follow the aggregate funnel from enrollment through clicks.
- 2Open rate uses sent messages as its denominator.
- 3Displayed Email click rate divides current Clicked status by current Opened status.
- 4Completion rate compares enrolled with currently active.
- 5Read active, non-active, and total enrollment counts together.
Displayed Opened status ÷ sentDisplayed Clicked status ÷ displayed Opened statusGoal conversions ÷ enrolled (currently dormant)(Enrolled − currently active) ÷ enrolledFunnel counts
- Enrolled — all enrollments that entered the Journey.
- Messages Sent — Journey messages accepted for a send attempt.
- Opened — Email messages currently counted with Opened status. After the periodic metrics refresh, a message that later reached Clicked status is no longer included here.
- Clicked — Email messages currently counted with Clicked status. Repeated clicks on the same message do not increase this aggregate, and SMS CTA clicks are not included.
- Goal Conversions — a currently dormant metric shown only when the Journey has goal settings.
A Journey can send multiple messages to one enrollment, so Messages Sent does not need to equal Enrolled.
Rates
- Open Rate is the displayed Opened count divided by sent.
- Click Rate is the displayed Clicked count divided by the displayed Opened count.
- Displayed Conversion Rate is goal conversions divided by enrolled.
- Completion Rate is enrolled minus currently active, divided by enrolled.
When the denominator is zero, FitStack shows 0.0%.
Active Journey metrics are scheduled for reconciliation every two hours. The refresh rebuilds Opened and Clicked from mutually exclusive current message statuses, so a message that advanced to Clicked stops contributing to Opened. Opened can decrease, and Click Rate can exceed 100%. Treat these values as a current status snapshot rather than a cumulative engagement funnel.
The displayed Clicked count is not click-event volume, and it does not include SMS CTA clicks. Do not interpret Clicked or Click Rate as all-channel click engagement.
FitStack does not currently process goal events for Journeys. Goal Conversions and the displayed Conversion Rate remain zero, and Goal Exits Journey does not stop enrollments. Do not use these fields to measure business outcomes or control follow-up.
The current card labeled Completed is calculated as every enrollment that is no longer currently active. That can include early exits or failures, not only members who reached an intended Completed workflow endpoint. Treat it as a non-active count and investigate business outcomes separately.
Review in context
Before drawing a conclusion:
- use Overview to confirm the trigger, audience, channels, active exit protections, and timeline;
- check whether a pause, cancel, unbound workflow warning, or recent publish changed exposure;
- compare counts and rates over a meaningful operating period;
- compare the aggregate engagement counts with the business outcome tracked in the system that owns it;
- investigate delivery, consent, and link configuration when engagement is unexpectedly low.
Current analytics boundary
Analytics is currently Journey-level. It does not provide a member list, per-step conversion, branch comparison, message-level drilldown, or aggregate SMS CTA click metric. It also does not preserve opened-before-clicked history in the reconciled Opened count.
Use Diagram to understand structure and Overview to understand configuration. Do not infer that a low aggregate rate identifies one specific step without additional operational evidence.