Review pipeline reporting and operations
Current Leads reporting provides an aggregate cross-club view. It is useful for volume, mix, status, and overall conversion, but it does not yet provide a named-pipeline funnel or AI-agent performance dashboard.
Read the Leads Dashboard
Open Leads → Dashboard and select the reporting period: 7 days, 30 days, 90 days, or all time.
The current 7-, 30-, and 90-day ranges end at the start of today, so Leads created later today are omitted from their cards and charts. Use All time or All Leads for same-day operational counts until this date boundary is corrected.
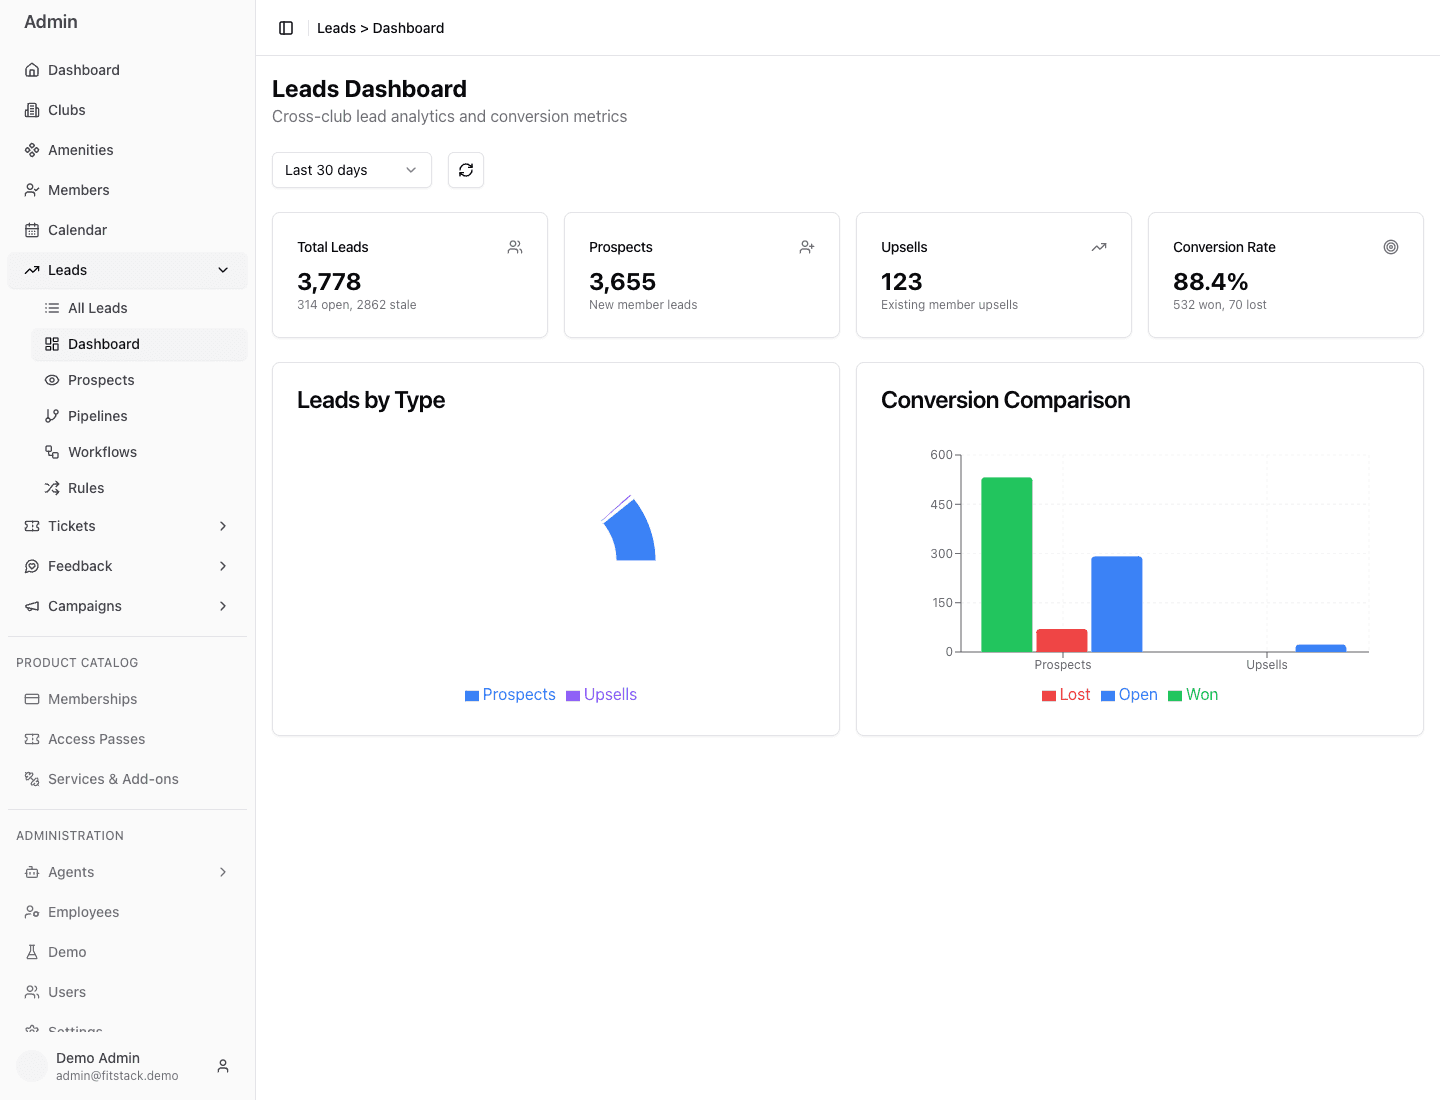
- 1Choose the date range before comparing results.
- 2Total Leads separates Open and Stale work.
- 3Conversion is Won divided by Won plus Lost.
- 4Compare Won, Lost, and Open outcomes by lead type.
Interpret the cards as follows:
- Total Leads — Leads created in the selected period, with Open and Stale counts shown beneath;
- Prospects — new-member opportunities;
- Upsells — existing-member additional-purchase opportunities;
- Conversion Rate —
Won ÷ (Won + Lost)for the selected period.
Open and Disqualified Leads are not included in the conversion denominator. A high or low rate can be misleading when many Leads remain open or disqualified, or when the period is too short for the normal sales cycle.
Current Retention reporting does not reconcile cleanly across these widgets. Total Leads includes Retention Leads, but the Prospects and Upsells cards exclude them. The lead-type outcome chart groups every non-Prospect Lead—including Retention—under Upsells. Use All Leads with the Retention type and pipeline filters for operational review; do not treat the current cards or chart as a reliable Retention breakdown.
Current and planned reporting boundary
Not available yet: named-pipeline funnel conversion, stage velocity, time in stage, stale rate by pipeline, workflow enrollment outcomes, and agent or channel performance. Treat these as planned reporting needs, not current Admin features.
Perform operational review in All Leads
Open Leads → All Leads when the dashboard raises a question. Filter by club, type, pipeline, stage, status, score, created date, or updated date. Edit visible columns when a review needs Stage or other context, and export the filtered set only under your organization’s data-handling policy.
Open one Lead to review:
- ownership and current pipeline stage;
- Notes for staff context;
- Activity for messages, calls, workflow events, and stage changes;
- consent status before communication decisions.
This is an operational investigation, not a substitute for aggregate pipeline-level analytics.
A practical weekly review
- Set a consistent Dashboard period and record Total, Open, Stale, Won, Lost, and overall conversion.
- Compare Prospects and Upsells without assuming they share the same cycle; review Retention separately in All Leads because of the current dashboard limitation.
- Open All Leads and filter stale or unexpectedly old work by pipeline and stage.
- Inspect a small sample of timelines for ownership, AI activity, human intervention, and the evidence behind movement.
- Record configuration or coaching questions separately from product defects.
- Avoid changing a workflow or stale policy from one anecdote; look for a repeated operating pattern.
Questions to preserve for future analytics
Until richer reporting is available, keep a shared list of decisions the team wants data to answer:
- Where do Leads leave or stall in each named pipeline?
- How long do Leads remain in each stage?
- Which workflows reach their configured goals?
- Where do humans intervene after AI engagement?
- Which agents and channels support conversion without increasing complaints or consent risk?
- How do outcomes differ by club, pipeline type, and intake source?
These questions help future dashboards serve an operating decision instead of adding metrics without a clear use.